Draft:Original research/Astrognosy
Astrognosy deals with the materials of celestial objects and their general exterior and interior constitution. It is a technical term in English.[1]
Generally, the performance of radiation astronomy yields facts about those portions of celestial objects such as the Sun or the Earth that are radiating at least in the direction of the telescopes and detectors where the observer is at.
But, what about the constitution of any celestial object with depth away from the radiating surface or near-surface region?
Sun[edit | edit source]


On the right is a model for the internal structure of the Sun.
The chromosphere (literally, "sphere of color") is the second of the three main layers in the Sun's atmosphere and is roughly 3,000 to 5,000 kilometers deep. The chromosphere's rosy red color is only apparent during eclipses. The chromosphere sits just above the photosphere and below the solar transition region. The layer of the chromosphere atop the photosphere is homogeneous. A forest of hairy-appearing spicules rise from the homogeneous layer, some of which extend 10,000 km into the corona above.
The density of the chromosphere is only 10−4 times that of the photosphere, the layer beneath, and 10−8 times that of the atmosphere of Earth at sea level. This makes the chromosphere normally invisible and it can be seen only during a total eclipse, where its reddish color is revealed. The color hues are anywhere between pink and red.[2] Without special equipment, the chromosphere cannot normally be seen due to the overwhelming brightness of the photosphere beneath.
The density of the chromosphere decreases with distance from the center of the Sun. This decreases exponentially from 1017 particles per cubic centimeter, or approximately 2×10⁻⁴
kg/m3 to under 1.6×10⁻¹¹
kg/m3 at the outer boundary.[3] The temperature decreases from the inner boundary at about 6,000 K[4] to a minimum of approximately 3,800 K,[5] before increasing to upwards of 35,000 K[4] at the outer boundary with the transition layer of the corona.
The image on the right of an annular eclipse shows the homogeneous layer of the chromosphere as a ring around the edge of the photosphere. The chromosphere is normally invisible and can be seen only during a total eclipse, where its reddish color is revealed. The color hues are anywhere between pink and red.
Mercury[edit | edit source]

A theory for the internal structure of Mercury is shown on the right, where
- Crust - 100-200 km thick,
- Mantle - 600 km thick, and
- Nucleus - 1,800 km radius.
Venus[edit | edit source]

On the right is a model for the interior structure of Venus.
Earth[edit | edit source]

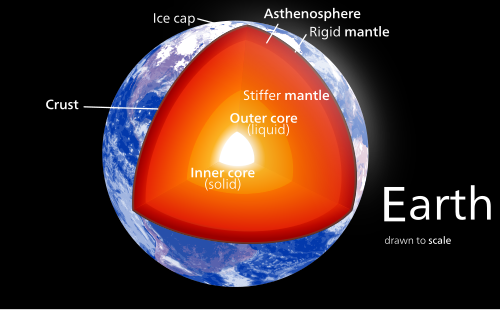
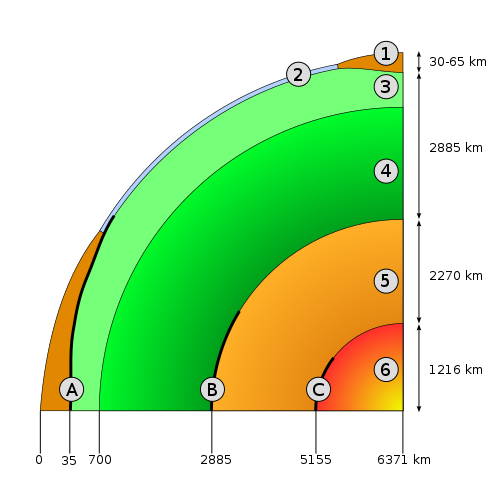
Evidence from geoseismology, heat flow at the surface, and mineral physics is combined with the Earth's mass and moment of inertia to infer models of the Earth's interior - its composition, density, temperature, pressure. For example, the Earth's mean specific gravity (5.515) is far higher than the typical specific gravity of rocks at the surface (2.7–3.3), implying that the deeper material is denser. This is also implied by its low moment of inertia (0.33 M R2, compared to 0.4 M R2 for a sphere of constant density). However, some of the density increase is compression under the enormous pressures inside the Earth. The effect of pressure can be calculated using the Adams–Williamson equation. The conclusion is that pressure alone cannot account for the increase in density.
Reconstruction of seismic reflections in the deep interior indicate some major discontinuities in seismic velocities that demarcate the major zones of the Earth: inner core, outer core, mantle, lithosphere and crust.
The seismic model of the Earth does not by itself determine the composition of the layers. For a complete model of the Earth, mineral physics is needed to interpret seismic velocities in terms of composition. The mineral properties are temperature-dependent, so the geotherm must also be determined. This requires physical theory for thermal conduction and convection and the heat contribution of [radionuclides] radioactive elements. The main model for the radial structure of the interior of the Earth is the Preliminary Reference Earth Model (PREM). Some parts of this model have been updated by recent findings in mineral physics (see post-perovskite) and supplemented by seismic tomography.
Shapes[edit | edit source]

Data for the shape of the Earth is from the Earth2014 global relief model.[6]
Due to rotation, the Earth is flattened at the poles and bulges around the equator.[7] The diameter of the Earth at the equator is 43 kilometres (27 mi) larger than the pole-to-pole diameter.[8] Thus the point on the surface farthest from Earth's center of mass is the summit of the equatorial Chimborazo volcano in Ecuador.[9] [10] [11][12] The average diameter of the reference spheroid is 12,742 kilometres (7,918 mi). Local topography deviates from this idealized spheroid, although on a global scale these deviations are small compared to Earth's radius: The maximum deviation of only 0.17% is at the Mariana Trench (10,911 metres (35,797 ft) below local sea level), whereas Mount Everest (8,848 metres (29,029 ft) above local sea level) represents a deviation of 0.14%. If Earth were shrunk to the size of a billiard ball, some areas of Earth such as large mountain ranges and oceanic trenches would feel like tiny imperfections, whereas much of the planet, including the Great Plains and the abyssal plains, would feel smoother.[13]
Crusts[edit | edit source]

Def. the "outermost layer of the lithosphere of the Earth"[14] is called the crust.
About 71% of Earth's surface is covered with water, mostly by oceans.[15]
The total surface area of Earth is about 510 million km2 (197 million sq mi).[16] Of this, 70.8%,[16] or 361.13 million km2 (139.43 million sq mi), is below sea level and covered by ocean water.[17] Below the ocean's surface are much of the continental shelf, mountains, volcanoes,[8] oceanic trenches, submarine canyons, oceanic plateaus, abyssal plains, and a globe-spanning mid-ocean ridge system. The remaining 29.2%, or 148.94 million km2 (57.51 million sq mi), not covered by water has terrain that varies greatly from place to place and consists of mountains, deserts, plains, plateaus, and other landforms. Tectonics and erosion, volcanic eruptions, flooding, weathering, glaciation, the growth of coral reefs, and meteorite impacts are among the processes that constantly reshape the Earth's surface over geological time.[18] [19]
| Compound | Formula | Composition | |
|---|---|---|---|
| Continental | Oceanic | ||
| silica | SiO2 | 60.6% | 48.6% |
| alumina | Al2O3 | 15.9% | 16.5% |
| lime | CaO | 6.41% | 12.3% |
| magnesia | MgO | 4.66% | 6.8% |
| iron oxide | FeOT | 6.71% | 6.2% |
| sodium oxide | Na2O | 3.07% | 2.6% |
| potassium oxide | K2O | 1.81% | 0.4% |
| titanium dioxide | TiO2 | 0.72% | 1.4% |
| diphosphorus pentoxide | P2O5 | 0.13% | 0.3% |
| manganese oxide | MnO | 0.10% | 1.4% |
| Total | 100.1% | 99.9% | |

| |
| Plate name | Area 106 km2 |
|---|---|
Pacific Plate |
103.3 |
African Plate[23] |
78.0 |
North American Plate |
75.9 |
Eurasian Plate |
67.8 |
Antarctic Plate |
60.9 |
Indo-Australian Plate |
47.2 |
South American Plate |
43.6 |
The fastest-moving plates are the oceanic plates, with the Cocos Plate advancing at a rate of 75 mm/a (3.0 in/year)[24] and the Pacific Plate moving 52–69 mm/a (2.0–2.7 in/year). At the other extreme, the slowest-moving plate is the Eurasian Plate, progressing at a typical rate of 21 mm/a (0.83 in/year).[25]
"By analysing levels of H2O and other molecules in microscopic "melt inclusions" caught in volcanic rock samples known as komatiites, [...] a new timeline for when seawater started getting pushed down from the surface into the mantle – the point when convection started occurring in Earth's mantle [has been derived]."[26]
The "ancient water droplets [had] been captured by the mineral olivine, found in komatiites from the Komatiite lava flow the rocks are named after – left behind by the hottest magma ever produced in Archaean Eon (4 billion to 2.5 billion years ago)."[26]
"The mechanism which caused the crust that had been altered by seawater to sink into the mantle functioned over 3.3 billion years ago. This means that a global cycle of matter, which underpins modern plate tectonics, was established within the first billion years of the Earth's existence, and the excess water in the transition zone of the mantle came from the ancient ocean on the planet's surface."[27]
"Plate tectonics constantly recycles the planet's matter, and without it the planet would look like Mars."[28]
"Our research showing that plate tectonics started 3.3 billion years ago now coincides with the period that life started on Earth. It tells us where the planet came from and how it evolved."[28]
"The komatiite [...] was taken from the Weltevreden Formation in the Barberton greenstone belt in South Africa."[26]
"We examined a piece of melt that was 10 microns [0.01 mm or three-ten-thousandths of an inch] in diameter, and analysed its chemical indicators such as H2O content, chlorine and deuterium/hydrogen ratio, and found that Earth's recycling process started about 600 million years earlier than originally thought."[28]
"We found that seawater was transported deep into the mantle and then re-emerged through volcanic plumes from the core-mantle boundary."[28]
"The chemical signature of the analysed rocks matches the lithospheric mantle – the uppermost part – from the Archaean, despite coming from further down in what's known as the transition zone between the upper and lower mantle."[26]
"That komatiites were able to grab so much water from so deep underground before being shot up to the surface suggests the plate tectonics cycle was happening earlier than 2.7 billion years ago – the current accepted starting point."[26]
Lithospheres[edit | edit source]

Between the crust and the mantle is the Mohorovičić discontinuity.[29]
Seismograms from shallow-focus earthquakes had two sets of P-waves and S-waves, one that followed a direct path near the Earth's surface and the other refracted by a high-velocity medium.[30]
The Mohorovičić discontinuity is 5 to 10 kilometres (3–6 mi) below the ocean floor, and 20 to 90 kilometres (10–60 mi) beneath typical continental crusts, with an average depth of 35 kilometres (22 mi).[31]
Immediately above the Moho, the velocities of primary seismic waves (P-waves) are consistent with those through basalt (6.7–7.2 km/s), and below they are similar to those through peridotite or dunite (7.6–8.6 km/s).[32]
The Moho is characterized by a transition zone of up to 500 m thick.[33]
Mantles[edit | edit source]
The mantle is mainly composed of silicates, and the boundaries between layers of the mantle are consistent with phase transitions.[34]
The mantle acts as a solid for seismic waves, but under high pressures and temperatures it deforms so that over millions of years it acts like a liquid. This makes plate tectonics possible. Geodynamics is the study of the fluid flow in the mantle and core.
The mantle itself is divided into the upper mantle, transition zone, lower mantle and D′′ layer.
Outer cores[edit | edit source]
Reconstructions of seismic waves in the deep interior of the Earth show that there are no S-waves in the outer core. This indicates that the outer core is liquid, because liquids cannot support shear. The outer core is liquid, and the motion of this highly conductive fluid generates the Earth's field (see geodynamo).
Inner cores[edit | edit source]
We know that the Earth's core is composed of an alloy of iron and other minerals.[34]
"A PKJKP [P wave, traversing the outer core K, and the inner core J, to emerge again as the P wave] traverses the inner core as a shear wave, so this is the direct evidence that the inner core is solid, because only in the solid material the shear wave can exist. In the liquid material, say water, only the compressional wave can travel through."[35]
Studying "archived data from about 20 large earthquakes, all monitored by an array of German seismic detectors back in the 1980s and '90s" has "reliably detected" a PKJKP wave in 2005, demonstrating that the inner core is solid.[36]
The inner core, however, is solid because of the enormous pressure.[29]
The inner core "is a solid ball of superhot iron and nickel alloy about 760 miles (1,220 kilometers) in diameter. ... the inner core is, at 10,800 degrees Fahrenheit (6,000 degrees Celsius), as hot as the surface of the sun."[37]
"We know the Earth's inner core is composed mostly of iron".[38]
"The metal [iron] was subjected to more than 200 billion pascals of pressure".[37]
"[M]aterial within Earth's inner core is apparently distributed in a lopsided way ... The weakness of iron might lead crystallites in the inner core to flow and line up a certain way".[37]
"[T]he speed at which the inner core spun apparently fluctuated over the course of approximately decades between 1961 and 2007."[37]
"As the inner core cools, crystallizing iron releases impurities, sending lighter molten material into the liquid outer core. This upwelling, combined with the Earth's rotation, drives convection, forcing the molten metal into whirling vortices. These vortices stretch and twist magnetic field lines, creating Earth’s magnetic field. Currently, the center of the field, called an axis, emerges in the Arctic Ocean west of Ellesmere Island, about 300 miles (500 kilometers) from the geographic North Pole."[39]
"In the last decade, seismic waves from earthquakes revealed the inner core looks like a navel orange, bulging slightly more on its western half. Geoscientists recently explained the asymmetry by proposing a convective loop: The inner core might be crystallizing on one half and melting on the other."[39]
"The lopsided growth of the inner core makes convection in the outer core a little bit lopsided, and that then induces the geomagnetic field to have this lopsided or eccentric character too".[40]
"Magnetic particles trapped and aligned in rocks reveal that the magnetic north pole wandered around the Western Hemisphere over the past 10,000 years, and circled the Eastern Hemisphere before that — a result mirrored by the numerical test."[39]
"The key question for interesting ideas like translational instability is, 'Can we test it?' ... What we're doing is proposing a test, and we think it's a good test because people can go out and look for eccentricity in the rock record and that will either confirm or shoot down this idea."[40]
"Within less than 100 million years, everything that has been crystallized on the west will have melted on the east"[41]
Seismic "waves appear to travel faster through the inner core from north to south than from west to east. Seismic properties also seemed to vary between the Eastern and Western hemispheres of the globe."[42]
There is a "124-mile (200-km) thick layer of dense material detected on its surface."[42]
"[T]he inner core [may be] shifted slightly off-center, just to the east. This would put more pressure on the western side, where it would be closer to the center of the planet, and less pressure on the eastern side. The result could be a perpetually denser Western hemisphere and a continual flow of dense fluid from the east that eventually spreads out atop the entire inner core."[42]
"The inner core is basically regenerating itself. And superimposed on that is this overall cooling that makes the inner core bigger and bigger over time".[43]
"It is the first observational evidence that the inner core rotates at a variety of speeds with respect to the mantle...It also reconciles old discrepancies".[44]
"The inner core, on average, rotates eastward. At the speeds it travels, it might, on average, complete a revolution every 750 to 1,440 years. However, these speeds appear unstable, which makes it uncertain just how long it actually takes to finish a turn on its axis".[37]
Moon[edit | edit source]

The internal structure of the Moon is modeled on the right and includes a core, mantle and crust.
Mars[edit | edit source]

"This artist's concept of the interior of Mars [on the right] shows a hot liquid core that is about one-half the radius of the planet. The core is mostly made of iron with some possible lighter elements such as sulfur. The mantle is the darker material between the core and the thin crust."[45]
"Mars has not cooled to a completely solid iron core, rather its interior is made up of either a completely liquid iron core or a liquid outer core with a solid inner core."[45]
"Earth has an outer liquid iron core and solid inner core. This may be the case for Mars as well."[45]
"Mars is influenced by the gravitational pull of the Sun. This causes a solid body tide with a bulge toward and away from the Sun (similar in concept to the tides on Earth). However, for Mars this bulge is much smaller, less than 1 centimeter (0.4 inch). By measuring this bulge in the Mars gravity field we can determine how flexible Mars is. The size of the measured tide is large enough to indicate the core of Mars can not be solid iron but must be at least partially liquid."[45]
"The tidal bulge is a very small but detectable force on the spacecraft. It causes a drift in the tilt of the spacecraft's orbit around Mars of one-thousandth of a degree over a month."[46]
"The precession is the slow motion of the spin pole of Mars as it moves along a cone in space (similar to a spinning top). For Mars, it takes 170,000 years to complete one revolution. The precession rate indicates how much the mass of Mars is concentrated toward the center. A faster precession rate indicates a larger dense core, compared to a slower precession rate."[45]
"Our results indicate the mass change for the southern carbon dioxide ice cap is 30 to 40 percent larger than the northern ice cap, which agrees well with the predictions of the global atmosphere models of Mars."[45]
"The amount of total mass change depends on assumptions about the shape of the sublimated portion of the cap. The largest mass exchange occurs if we assume the cap change is uniform or flat over the entire cap, while the lowest mass exchange corresponds to a conically shaped cap change."[45]
Ceres[edit | edit source]

"Observations of 1 Ceres, the largest known asteroid, have revealed that the object may be a "mini planet," and may contain large amounts of pure water ice beneath its surface."[47]
"The observations by NASA's Hubble Space Telescope also show that Ceres shares characteristics of the rocky, terrestrial planets like Earth. Ceres' shape is almost round like Earth's, suggesting that the asteroid may have a "differentiated interior," with a rocky inner core and a thin, dusty outer crust."[47]
"Ceres is an embryonic planet."[47]
"Gravitational perturbations from Jupiter billions of years ago prevented Ceres from accreting more material to become a full-fledged planet."[47]
"Hubble snapped 267 images of Ceres. From those snapshots, the astronomers determined that the asteroid has a nearly round body. The diameter at its equator is wider than at its poles. Computer models show that a nearly round object like Ceres has a differentiated interior, with denser material at the core and lighter minerals near the surface. All terrestrial planets have differentiated interiors. Asteroids much smaller than Ceres have not been found to have such interiors."[47]
Jupiter[edit | edit source]
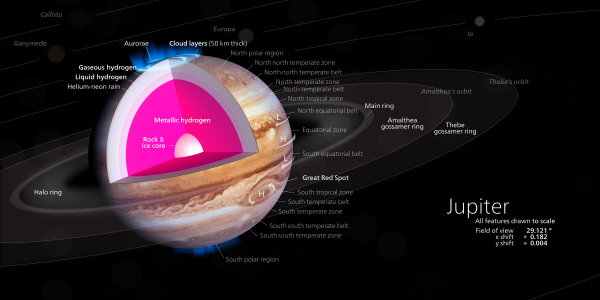
The model for the interior of Jupiter suggests the occurrence of such materials as metallic hydrogen.
Callisto[edit | edit source]

The theoretical internal structure model for Callisto on the right includes rock, monoclinic ice, tetragonal ice, hexagonal ice, and cubic ice.
Europa[edit | edit source]

On the right is a model for the internal structure of Europa.
Ganymede[edit | edit source]


A variety of models have been suggested for the interior constitution of Ganymede. The first diagram at the right suggests ice, water, and an iron-based core.
The first image at the left suggests another interior: "The cut-out reveals the interior structure of this icy moon. This structure consists of four layers based on measurements of Ganymede's gravity field and theoretical analyses using Ganymede's known mass, size and density. Ganymede's surface is rich in water ice and Voyager and Galileo images show features which are evidence of geological and tectonic disruption of the surface in the past. As with the Earth, these geological features reflect forces and processes deep within Ganymede's interior. Based on geochemical and geophysical models, scientists expected Ganymede's interior to either consist of: a) an undifferentiated mixture of rock and ice or b) a differentiated structure with a large lunar sized "core" of rock and possibly iron overlain by a deep layer of warm soft ice capped by a thin cold rigid ice crust. Galileo's measurement of Ganymede's gravity field during its first and second encounters with the huge moon have basically confirmed the differentiated model and allowed scientists to estimate the size of these layers more accurately. In addition the data strongly suggest that a dense metallic core exists at the center of the rock core. This metallic core suggests a greater degree of heating at sometime in Ganymede's past than had been proposed before and may be the source of Ganymede's magnetic field discovered by Galileo's space physics experiments."[48]
The second image at the right suggests a variety of pressure-related ices similar to the model directly above it.
This "new model, based on experiments in the laboratory that simulate salty seas, shows that the ocean and ice may be stacked up in multiple layers, more like a club sandwich."[49]
"Ice comes in different forms depending on pressures. "Ice I," the least dense form of ice, is what floats in your chilled beverages. As pressures increase, ice molecules become more tightly packed and thus more dense. Because Ganymede's oceans are up to 500 miles (800 kilometers) deep, they would experience more pressure than Earth's oceans. The deepest and most dense form of ice thought to exist on Ganymede is called "Ice VI." [...] With enough salt, liquid in Ganymede can become dense enough to sink to the very bottom of the seafloor, below Ice VI. [...] What's more, the model shows that a strange phenomenon might occur in the uppermost liquid layer, where ice floats upward. In this scenario, cold plumes cause Ice III to form. As the ice forms, salt precipitates out. The salt then sinks down while the ice "snows" upward. Eventually, this ice would melt, resulting in a slushy layer in Ganymede's club sandwich structure."[49]
Io[edit | edit source]

A model for the internal structure of Io shown on the right includes an ultramafic mantle and an iron and iron sulfide core.
Saturn[edit | edit source]

The internal structure of the gaseous giant Saturn is modeled on the right.
Enceladus[edit | edit source]

"This diagram illustrates the possible interior of Saturn's moon Enceladus based on a gravity investigation by NASA's Cassini spacecraft and NASA's Deep Space Network, reported in April 2014. The gravity measurements suggest an ice outer shell and a low density, rocky core with a regional water ocean sandwiched in between at high southern latitudes."[50]
"Views from Cassini's imaging science subsystem were used to depict the surface geology of Enceladus and the plume of water jets gushing from fractures near the moon's south pole."[50]
"Enceladus is 313 miles (504 kilometers) in diameter."[50]
The Cassini–Huygens spacecraft started multiple close flybys of Enceladus, revealing its surface and environment in greater detail: water-rich plumes venting from the south polar region.[51]; Cryovolcanoes near the south pole that shoot geyser-like jets of water vapor, molecular hydrogen, other volatiles, and solid material, including sodium chloride crystals and ice particles, into space, totaling about 200 kg (440 lb) per second.[52][53][54]
Over 100 geysers have been identified.[55] Some of the water vapor falls back as "snow"; the rest escapes, and supplies most of the material making up Saturn's E ring.[56][57] The plumes are similar in composition to comets.[58] In 2014, Cassini found evidence for a large south polar subsurface ocean of liquid water with a thickness of around 10 km (6 mi).[59][60][61]
Titan[edit | edit source]

The internal structure of Titan is modeled on the right according to the fully differentiated dense-ocean model.
Uranus[edit | edit source]

Uranus has a core and a mantle as shown in the model on the right.
Neptune[edit | edit source]

"The atmosphere of Neptune, similar to Uranus, consists of mainly hydrogen, methane, and helium. Below it is a liquid hydrogen layer including helium and methane. The lower layer is liquid hydrogen compounds, oxygen, and nitrogen. It is believed that the planet core comprises rock and ice. Average density, as well as the greatest proportion of core per planet size, is the greatest among the gaseous planets."[62]
Hypotheses[edit | edit source]
- The cores of each astronomical spheroidal object in orbit around the Sun has a systematically higher positive charge than the surface of the object.
See also[edit | edit source]
References[edit | edit source]
- ↑ Douglas O. Gough (October 1996). "Astereoasteroseismology". The Observatory 116 (10): 313-5.
- ↑ Freedman, R. A.; Kaufmann III, W. J. (2008). Universe. New York, USA: W. H. Freeman and Company. p. 762. ISBN 978-0-7167-8584-2. https://archive.org/details/universe0008edfree.
- ↑ Kontar, E. P.; Hannah, I. G.; Mackinnon, A. L. (2008). "Chromospheric magnetic field and density structure measurements using hard X-rays in a flaring coronal loop". Astronomy and Astrophysics 489 (3): L57. doi:10.1051/0004-6361:200810719.
- ↑ 4.0 4.1 "SP-402 A New Sun: The Solar Results From Skylab". 2004-11-18.
- ↑ Avrett, E. H. (2003). "The Solar Temperature Minimum and Chromosphere". ASP Conference Series 286: 419. ISBN 978-1-58381-129-0.
- ↑ Earth2014 global topography (relief) model. Institut für Astronomische und Physikalische Geodäsie. http://www.iapg.bgu.tum.de/9321785--~iapg~forschung~Topographie~Earth2014.html. Retrieved 4 March 2016.
- ↑ Milbert, D. G.; Smith, D. A. Converting GPS Height into NAVD88 Elevation with the GEOID96 Geoid Height Model. National Geodetic Survey, NOAA. http://www.ngs.noaa.gov/PUBS_LIB/gislis96.html. Retrieved 7 March 2007.
- ↑ 8.0 8.1 Sandwell, D. T.; Smith, W. H. F. (7 July 2006). Exploring the Ocean Basins with Satellite Altimeter Data. NOAA/NGDC. http://www.ngdc.noaa.gov/mgg/bathymetry/predicted/explore.HTML. Retrieved 21 April 2007.
- ↑ Senne, Joseph H. (2000). "Did Edmund Hillary Climb the Wrong Mountain". Professional Surveyor 20 (5): 16–21. http://archives.profsurv.com/magazine/article.aspx?i=589.
- ↑ Sharp, David (5 March 2005). "Chimborazo and the old kilogram". The Lancet 365 (9462): 831–32. doi:10.1016/S0140-6736(05)71021-7. PMID 15752514.
- ↑ Tall Tales about Highest Peaks. Australian Broadcasting Corporation. 2004-04-15. http://www.abc.net.au/science/k2/moments/s1086384.htm. Retrieved 29 December 2008.
- ↑ The 'Highest' Spot on Earth. NPR. 7 April 2007. https://www.npr.org/templates/story/story.php?storyId=9428163. Retrieved 31 July 2012.
- ↑ Is a Pool Ball Smoother than the Earth?. Billiards Digest. 1 June 2013. http://billiards.colostate.edu/bd_articles/2013/june13.pdf. Retrieved 26 November 2014.
- ↑ Algrif (6 June 2008). "crust". San Francisco, California: Wikimedia Foundation, Inc. Retrieved 1 December 2018.
{{cite web}}:|author=has generic name (help) - ↑ National Oceanic and Atmospheric Administration. Ocean. http://www.noaa.gov/ocean.html. Retrieved 3 May 2013.
- ↑ 16.0 16.1 Pidwirny, Michael (2 February 2006). Surface area of our planet covered by oceans and continents.(Table 8o-1). University of British Columbia, Okanagan. http://www.physicalgeography.net/fundamentals/8o.html. Retrieved 26 November 2007.
- ↑ World Factbook. Cia.gov. https://www.cia.gov/library/publications/the-world-factbook/geos/xx.html. Retrieved 2 November 2012.
- ↑ Kring, David A. Terrestrial Impact Cratering and Its Environmental Effects. Lunar and Planetary Laboratory. http://www.lpi.usra.edu/science/kring/epo_web/impact_cratering/intro/. Retrieved 22 March 2007.
- ↑ Martin, Ronald (2011). Earth's Evolving Systems: The History of Planet Earth. Jones & Bartlett Learning. ISBN 978-0-7637-8001-2. https://books.google.com/books?id=agaOKrvAoeAC.
- ↑ Rudnick, R. L.; Gao, S. (2003). "Composition of the Continental Crust". In Holland, H. D.; Turekian, K. K.. Treatise on Geochemistry. 3. New York: Elsevier Science. 1–64. doi:10.1016/B0-08-043751-6/03016-4. ISBN 978-0-08-043751-4. Bibcode: 2003TrGeo...3....1R.
- ↑ White, W. M.; Klein, E. M. (2014). "Composition of the Oceanic Crust". In Holland, H. D.; Turekian, K. K.. Treatise on Geochemistry. 4. New York: Elsevier Science. pp. 457–496. doi:10.1016/B978-0-08-095975-7.00315-6. ISBN 978-0-08-098300-4.
- ↑ Brown, W. K.; Wohletz, K. H. (2005). SFT and the Earth's Tectonic Plates. Los Alamos National Laboratory. http://www.lanl.gov/orgs/ees/geodynamics/Wohletz/SFT-Tectonics.htm. Retrieved 2 March 2007.
- ↑ Including the Somali Plate, which is being formed out of the African Plate. See: Chorowicz, Jean (October 2005). "The East African rift system". Journal of African Earth Sciences 43 (1–3): 379–410. doi:10.1016/j.jafrearsci.2005.07.019.
- ↑ Meschede, Martin; Barckhausen, Udo (20 November 2000). Plate Tectonic Evolution of the Cocos-Nazca Spreading Center, In: Proceedings of the Ocean Drilling Program. Texas A&M University. http://www-odp.tamu.edu/publications/170_SR/chap_07/chap_07.htm. Retrieved 2 April 2007.
- ↑ Staff. GPS Time Series. NASA JPL. http://sideshow.jpl.nasa.gov/mbh/series.html. Retrieved 2 April 2007.
- ↑ 26.0 26.1 26.2 26.3 26.4 David Nield (6 August 2019). "Ancient Water Drops May Have Just Changed The Timeline of Earth's Plate Tectonics". Science Alert. Retrieved 12 August 2019.
- ↑ Alexander Sobolev (6 August 2019). "Ancient Water Drops May Have Just Changed The Timeline of Earth's Plate Tectonics". Science Alert. Retrieved 12 August 2019.
- ↑ 28.0 28.1 28.2 28.3 Allan Wilson (6 August 2019). "Ancient Water Drops May Have Just Changed The Timeline of Earth's Plate Tectonics". Science Alert. Retrieved 12 August 2019.
- ↑ 29.0 29.1 William Lowrie (2004). Fundamentals of Geophysics. Cambridge University Press. ISBN 0-521-46164-2.
- ↑ Andrew McLeish (1992). Geological science (2nd ed.). Thomas Nelson & Sons. p. 122. ISBN 0-17-448221-3. https://books.google.com/books?id=rhkgwEvrVe8C&pg=PA122.
- ↑ James Stewart Monroe and Reed Wicander (2008). The changing Earth: exploring geology and evolution (5th ed.). Cengage Learning. p. 216. ISBN 0-495-55480-4. https://books.google.com/books?id=jFPMa4MxwJkC&pg=PA216.
- ↑ RB Cathcart,MM Ćirković (2006). Viorel Badescu. ed. Macro-engineering: a challenge for the future. Springer. p. 169. ISBN 1-4020-3739-2. https://books.google.com/books?id=5bZBEM31K1MC&pg=PA169.
- ↑ D.P. McKenzie - The Mohorovičić Discontinuity
- ↑ 34.0 34.1 Jean-Paul Poirier (2000). Introduction to the Physics of the Earth's Interior. Cambridge Topics in Mineral Physics & Chemistry. Cambridge University Press. ISBN 0-521-66313-X.
- ↑ Aimin Cao (April 14, 2005). Finally, a Solid Look at Earth's Core. Live Science. http://www.livescience.com/6980-finally-solid-earth-core.html. Retrieved 2013-05-14.
- ↑ Robert Roy Britt (April 14, 2005). Finally, a Solid Look at Earth's Core. Live Science. http://www.livescience.com/6980-finally-solid-earth-core.html. Retrieved 2013-05-14.
- ↑ 37.0 37.1 37.2 37.3 37.4 Charles Q. Choi (May 13, 2013). Earth's Rotating Inner Core Shifts Its Speed. Yahoo! News. http://news.yahoo.com/earths-rotating-inner-core-shifts-speed-184844196.html. Retrieved 2013-05-14.
- ↑ Arianna Gleason (May 13, 2013). Earth's Rotating Inner Core Shifts Its Speed. Yahoo! News. http://news.yahoo.com/earths-rotating-inner-core-shifts-speed-184844196.html. Retrieved 2013-05-14.
- ↑ 39.0 39.1 39.2 Becky Oskin (July 18, 2012). Why Earth's Magnetic Field Is Wonky. LiveScience. http://www.livescience.com/21668-why-earth-magnetic-field-wonky.html. Retrieved 2013-05-14.
- ↑ 40.0 40.1 Peter Olson (July 18, 2012). Why Earth's Magnetic Field Is Wonky. LiveScience. http://www.livescience.com/21668-why-earth-magnetic-field-wonky.html. Retrieved 2013-05-14.
- ↑ Thierry Alboussiere (August 4, 2010). Earth's Inner Core Might Be on the Move. Live Science. http://www.livescience.com/8409-earth-core-move.html. Retrieved 2013-05-14.
- ↑ 42.0 42.1 42.2 Lynne Peeples (August 4, 2010). Earth's Inner Core Might Be on the Move. Live Science. http://www.livescience.com/8409-earth-core-move.html. Retrieved 2013-05-14.
- ↑ Michael Bergman (August 4, 2010). Earth's Inner Core Might Be on the Move. Live Science. http://www.livescience.com/8409-earth-core-move.html. Retrieved 2013-05-14.
- ↑ Hrvoje Tkalcic (May 13, 2013). Earth's Rotating Inner Core Shifts Its Speed. Yahoo! News. http://news.yahoo.com/earths-rotating-inner-core-shifts-speed-184844196.html. Retrieved 2013-05-14.
- ↑ 45.0 45.1 45.2 45.3 45.4 45.5 45.6 Charles Yoder (6 March 2003). Scientists Say Mars Has a Liquid Iron Core. Pasadena, California USA: NASA/JPL. http://mars.jpl.nasa.gov/newsroom/pressreleases/20030306a.html. Retrieved 2015-02-04.
- ↑ Alex Konopliv (6 March 2003). Scientists Say Mars Has a Liquid Iron Core. Pasadena, California USA: NASA/JPL. http://mars.jpl.nasa.gov/newsroom/pressreleases/20030306a.html. Retrieved 2015-02-04.
- ↑ 47.0 47.1 47.2 47.3 47.4 Lucy A. McFadden (7 September 2005). Largest Asteroid May Be 'Mini Planet' with Water Ice. Baltimore, Maryland USA: HubbleSite. http://hubblesite.org/newscenter/archive/releases/2005/27/text/. Retrieved 2015-02-04.
- ↑ Sue Lavoie (December 16, 1997). PIA00519: Ganymede G1 & G2 Encounters - Interior of Ganymede. Pasadena, California USA: NASA/JPL. http://photojournal.jpl.nasa.gov/catalog/PIA00519. Retrieved 2014-06-11.
- ↑ 49.0 49.1 Jon Nelson (May 1, 2014). Possible 'Moonwich' of Ice and Oceans on Ganymede (Artist's Concept). Pasadena, California USA: NASA/JPL. http://www.jpl.nasa.gov/spaceimages/details.php?id=PIA18005. Retrieved 2014-06-11.
- ↑ 50.0 50.1 50.2 Jon Nelson (3 April 2014). Ocean Inside Saturn's Moon Enceladus. Pasadena, California USA: NASA/JPL. http://www.jpl.nasa.gov/spaceimages/details.php?id=PIA18071. Retrieved 19 May 2015.
- ↑ Chang, Kenneth (March 12, 2015). "Suddenly, It Seems, Water Is Everywhere in Solar System". The New York Times. Retrieved March 13, 2015.
- ↑ Hansen, Candice J.; Esposito, L., et al. (2006). "Enceladus' Water Vapor Plume". Science 311 (5766): 1422–5. doi:10.1126/science.1121254. PMID 16527971.
- ↑ Lovett, Richard A. (September 4, 2012). "Secret life of Saturn's moon: Enceladus". Cosmos Magazine. Retrieved August 29, 2013.
- ↑ Spencer, J. R.; Nimmo, F. (May 2013). "Enceladus: An Active Ice World in the Saturn System". Annual Review of Earth and Planetary Sciences 41: 693–717. doi:10.1146/annurev-earth-050212-124025.
- ↑ Dyches, Preston; Brown, Dwayne; et al. (July 28, 2014). "Cassini Spacecraft Reveals 101 Geysers and More on Icy Saturn Moon". NASA. Retrieved July 29, 2014.
- ↑ "Icy Tendrils Reaching into Saturn Ring Traced to Their Source". NASA News. April 14, 2015. Retrieved April 15, 2015.
- ↑ "Ghostly Fingers of Enceladus". NASA/JPL/Space Science Institute. NASA. September 19, 2006. Retrieved April 26, 2014.
- ↑ Battersby, Stephen (March 26, 2008). "Saturn's moon Enceladus surprisingly comet-like". New Scientist. Retrieved April 16, 2015.
- ↑ Platt, Jane; Bell, Brian (April 3, 2014). "NASA Space Assets Detect Ocean inside Saturn Moon". NASA. Retrieved April 3, 2014.
- ↑ Witze, A. (April 3, 2014). "Icy Enceladus hides a watery ocean". Nature. doi:10.1038/nature.2014.14985. http://www.nature.com/news/icy-enceladus-hides-a-watery-ocean-1.14985.
- ↑ Iess, L.; Stevenson, D. J., et al. (April 4, 2014). "The Gravity Field and Interior Structure of Enceladus". Science 344 (6179): 78–80. doi:10.1126/science.1250551. PMID 24700854.
- ↑ Autumn Burdick (20 January 2011). Neptune's Interior. Washington, DC USA: NASA. http://solarsystem.nasa.gov/multimedia/display.cfm?IM_ID=283. Retrieved 2015-02-04.
External links[edit | edit source]
- Bing Advanced search
- Google Books
- Google scholar Advanced Scholar Search
- International Astronomical Union
- JSTOR
- Lycos search
- NASA/IPAC Extragalactic Database - NED
- NASA's National Space Science Data Center
- Office of Scientific & Technical Information
- Questia - The Online Library of Books and Journals
- SAGE journals online
- The SAO/NASA Astrophysics Data System
- Scirus for scientific information only advanced search
- SDSS Quick Look tool: SkyServer
- SIMBAD Astronomical Database
- SIMBAD Web interface, Harvard alternate
- Spacecraft Query at NASA
- SpringerLink
- Taylor & Francis Online
- Universal coordinate converter
- Wiley Online Library Advanced Search
- Yahoo Advanced Web Search
{{History of science resources}}{{Radiation astronomy resources}}
Learn more about Astrognosy |