


The countries of the Persian Gulf are highly arid and dependent on groundwater reserves to fend of drought and water scarcity. Further, cities and critical infrastructures are often found on the coast, and this combination makes the area extremely vulnerable to sea level rise.
Earth.Org takes a closer look.
—
Article adapted and reposted from Carboun.com, written by Karim Elgendy.
As the last ice age ended, the earth’s climate began to warm up, glaciers and ice sheets started to melt, and sea levels rose globally. With sea levels rising, seawater (once again) flooded into the Gulf (also known as the Persian Gulf or Arabia Gulf), whose sea floor was exposed for millennia and covered in sand dunes (except for lakes and the Tigris-Euphrates river meandering across it towards the Arabian sea).

Sea levels rose by 125 meters until they peaked 1 – 2 meters above today’s levels, 4,000–5,000 years ago. They then dropped to the present levels and settled for the last 2500 years.
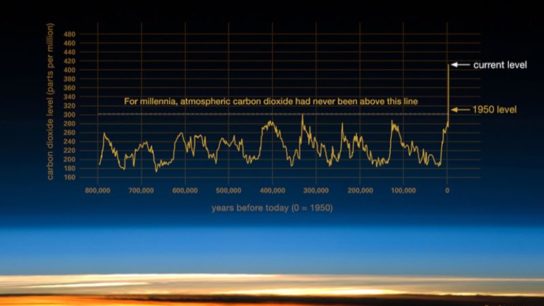
But since the beginning of the 20th century the world witnessed a new type of sea level rise, driven by Climate Change caused by human activity. Seas rose by 0.16-0.21 meters between 1900-2016 and are set to rise much faster if current trends continue. Naturally, the low-lying coastal areas around the Gulf are at risk again. The only difference being that we have now built cities and infrastructure on them.
To protect these investments and communities living there, we must mitigate further climate change by cutting our Carbon Emissions enough to meet the 1.5 degree target.
Cities of the region must also collaborate to develop a pan-regional comprehensive resilience strategy that protects their built environment, their infrastructure, and the future of the next generations who would like to call this region home.
In order to illustrate the need for action, Earth.Org has modelled what extreme sea level rise could look like in the Persian Gulf by the end of the century.

Sea level rise projections by 2100 for two scenarios with the amount of rise in meters indicated (mild = 1m; extreme = 3m). Population displacement indicated bottom right.
Sea Level Rise Methodology
Global mean sea level is projected to rise by 2m at the end of this century. However, in order to determine local sea level rise (SLR), one has to take into account local coastal flood levels which could be 2.8m above Mean Higher-High Water (MHHW) at extreme forecasts. These local levels bring variability to the projected SLR from 1m to 6.5m (eg. Rio vs Kolkata).
The SLR scenarios used in this study are based on the forecasts from Climate Central – Coastal Risk Screening Tool with the following parameters:
- Sea level Projection Source
- Coastal Flood Level
- Pollution Scenario
- Luck
Sea level Projection Source:
From two highly cited journals by Kopp et al., estimating SLR mainly due to ocean thermal expansion and ice melt. The mid-range scenario projected 0.5-1.2m of SLR based on different representative concentration pathways (RCP) defined by the IPCC. While the pessimistic scenario added more mechanisms of ice-sheet melting, estimating SLR at 1m-2.5m in 2100, with a projection of 10m SLR at 2300.
Coastal Flooding
More frequent coastal flooding is a direct impact of sea-level rise. Based on the Global tides and surge reanalysis by Muis et al., (2016), it is estimated that the extreme coastal water level could be from 0.2 – 2.8m over the mean level. While in extreme cases like China and the Netherlands it could experience 5-10m of extreme sea levels. Here, the coastal local flood level is added on top of the projected SLR.
Pollution Scenario:
Allows choosing the RCP, the greenhouse gas concentration trajectory defined by the IPCC. The mild level is based on RCP4.5, of 2°C temperature rise; while the Extreme level is based on RCP 8.5, of 4°C temperature rise.
Luck:
Applies to the baseline SLR, defined in the “Sea level projection” section, upon which we add flooding. “Mild” refers to the mid-range scenario of 0.5-1.2m, and “extreme” to the pessimistic scenario of 1-2.5m. We used the high-end value of each scenario (mild = 1m; extreme = 2.5m).
You might also like: Sea Level Rise by 2100 – New York City
References:
-
Kulp, Scott A., and Benjamin H. Strauss. “New elevation data triple estimates of global vulnerability to sea-level rise and coastal flooding.” Nature communications 10.1 (2019): 1-12.
-
Florczyk, A. J., Corbane, C., Ehrlich, D., Freire, S., Kemper, T., Maffenini, L., Melchiorri, M., Politis, P., Schiavina, M., Sabo, F. & Zanchetta, L. (2019). GHSL Data Package 2019 Public Release.
-
Kopp, R. E., DeConto, R. M., Bader, D. A., Hay, C. C., Horton, R. M., Kulp, S., Oppenheimer, M., Pollard, D. & Strauss, B. H. (2017). Evolving Understanding of Antarctic Ice-Sheet Physics and Ambiguity in Probabilistic Sea-Level Projections. Earth’s Future, 5(12), 1217–1233.
-
Kopp, R. E., Horton, R. M., Little, C. M., Mitrovica, J. X., Oppenheimer, M., Rasmussen, D. J., Strauss, B. H. & Tebaldi, C. (2014). Probabilistic 21st and 22nd Century Sea-Level Projections at a Global Network of Tide-Gauge Sites. Earth’s Future, 2(8), 383–406.
-
Kulp, S. A. & Strauss, B. H. (2019). New Elevation Data Triple Estimates of Global Vulnerability to Sea-Level Rise and Coastal Flooding. Nature Communications, 10(1), 4844. Retrieved June 21, 2020, from http://www.nature.com/articles/s41467-019-12808-z
-
Muis, S., Verlaan, M., Winsemius, H. C., Aerts, J. C. J. H. & Ward, P. J. (2016). A Global Reanalysis of Storm Surges and Extreme Sea Levels. Nature Communications, 7.
![The Statistics of Biodiversity Loss [2020 WWF Report]](https://u4d2z7k9.rocketcdn.me/wp-content/uploads/2020/12/lprwinkyTHB-544x306.jpg)


