Category:Energy diagrams
Subcategories
This category has the following 20 subcategories, out of 20 total.
B
D
- Energy and society diagrams (3 F)
E
F
H
- Heat exchanger diagrams (1 P, 133 F)
I
L
N
- Natural gas diagrams (43 F)
P
R
S
T
Media in category "Energy diagrams"
The following 200 files are in this category, out of 327 total.
(previous page) (next page)-
Aktivierungsenergie Verbrennung von Zucker.svg 935 × 537; 94 KB
-
Aktivierungsenergie-Lagerfeuer.svg 512 × 255; 228 KB
-
Albedoga.png 3,232 × 2,584; 3.32 MB
-
Algerije Energie 1965-2010.png 1,800 × 1,200; 19 KB
-
Alim-symetrique.png 158 × 147; 2 KB
-
ARCHIMEDES WAS WRONG.jpg 1,520 × 982; 701 KB
-
Atom in box.JPG 556 × 352; 23 KB
-
ATP cycle ku.png 1,885 × 1,058; 262 KB
-
ATP cycle.png 6,473 × 4,499; 620 KB
-
ATP molecule.png 2,590 × 1,419; 89 KB
-
ATP-PC.jpg 646 × 691; 41 KB
-
ATPsyn.gif 300 × 256; 88 KB
-
Bacteriorhodopsin chemiosmosis.gif 880 × 1,190; 77 KB
-
Balancing Supply and Demand in the Grid.jpg 1,230 × 931; 92 KB
-
BDP po državama EU novo.jpg 2,802 × 2,706; 336 KB
-
Belier demolition bacpro batEOGT 2006.svg 166 × 199; 9 KB
-
Belsohom.png 512 × 288; 4 KB
-
BenjaminTignerFig5US8066225.JPG 511 × 334; 44 KB
-
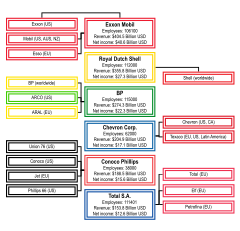
Big Oil 2022.jpg 2,250 × 4,000; 650 KB
-
Big oil.jpg 580 × 530; 229 KB
-
Big Oil.svg 750 × 720; 466 KB
-
Bilan énergétique France 2020 d'après SDES et blocs.png 2,000 × 1,539; 314 KB
-
Bilan énergétique France 2020 french energy balance From SDES open data.png 1,850 × 1,539; 288 KB
-
Biogasanlage Schema Trockenvergärung.png 3,579 × 2,551; 3.65 MB
-
Blockfließbild EBSEnergiezentrale.jpg 1,024 × 731; 83 KB
-
Bond Energy Diagrams.png 861 × 246; 100 KB
-
Butane conformations and relative energies.svg 1,013 × 413; 48 KB
-
Carbon flow new.jpg 400 × 200; 11 KB
-
Carbon flow.jpg 1,200 × 600; 46 KB
-
Cathode materials.jpg 575 × 204; 15 KB
-
Cellular respiration.gif 880 × 887; 80 KB
-
Chaisson's figure2.jpg 2,999 × 2,249; 807 KB
-
Chart it77.png 558 × 333; 11 KB
-
Chart MPG to L-100km v2009-10-08.svg 1,313 × 910; 223 KB
-
Chart MPG to Litre-100km.svg 778 × 470; 36 KB
-
CHEMICAL REACTIONS VIA ANNIHILATION AND REPLACEMENT.png 600 × 600; 82 KB
-
Chemins de l'énergie.png 1,085 × 658; 151 KB
-
Chemiosmotic coupling mitochondrion.gif 400 × 259; 17 KB
-
Chemiosmotic proton transfer.gif 800 × 660; 56 KB
-
Chemiosmotic proton transfer.tr.png 727 × 600; 52 KB
-
CicloCombinadoVSdemanda.png 877 × 571; 20 KB
-
CicloCombinadoVSdemandaSpain.png 876 × 572; 19 KB
-
Clasificacion8.jpg 559 × 546; 74 KB
-
CO2 emissions by energy source.jpg 1,340 × 630; 62 KB
-
Co2 ja ydinvoima.png 754 × 721; 4 KB
-
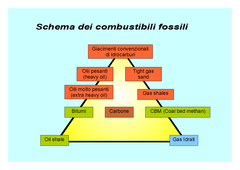
Combustibili fossili.png 1,123 × 794; 2.55 MB
-
Combustibili fossili.svg 512 × 362; 1.18 MB
-
Composición accionaria Transener.png 748 × 418; 73 KB
-
COMPRESSED AIR IS MORE POWERFUL AND ECONOMIC OF HYDROGEN.jpg 1,520 × 982; 718 KB
-
Consommation energie residentiel.png 703 × 385; 29 KB
-
Consumption sector treemap.png 1,800 × 1,500; 329 KB
-
Cuadro sinóptico sobre energia eólica.png 1,280 × 720; 70 KB
-
-
-
Current U.S. and Global Oil,Energy Situation.jpg 600 × 279; 42 KB
-
Cycle Energie.svg 651 × 720; 182 KB
-
Cyclohexane conformations and energies with hydrogens.svg 512 × 291; 18 KB
-
Cyclohexane ring flip and relative conformation energies.svg 849 × 483; 17 KB
-
DayaheadPreise2020.png 700 × 250; 7 KB
-
Deaerator.png 296 × 299; 7 KB
-
Dedicated Outdoor Air System (DOAS) Diagram.png 1,040 × 585; 85 KB
-
Definición del Joule.svg 480 × 480; 77 KB
-
Deklinasyon.jpg 1,920 × 1,080; 160 KB
-
Deklinasyon.png 1,920 × 1,080; 710 KB
-
DER-CAM Concept.jpg 1,212 × 822; 123 KB
-
DER-CAM Structure.png 1,342 × 673; 253 KB
-
Diagram of Hydraulic Fracking.jpg 1,337 × 1,353; 717 KB
-
DigitalSTROM english.png 1,052 × 744; 142 KB
-
DigitalSTROM.svg 1,052 × 744; 74 KB
-
DIY PV Rack Graphical Abstract.jpg 2,362 × 1,180; 3.28 MB
-
Działanie silnika WASE2.jpg 951 × 515; 104 KB
-
-
ECOLCA Greenhouse gases.jpg 609 × 387; 31 KB
-
Ecuacion general del balance de energia explicacion de terminos.png 1,391 × 680; 82 KB
-
EEnergy SmartGrid.jpg 953 × 951; 168 KB
-
EEX-Preise strom 2022.png 1,000 × 600; 13 KB
-
EFMS.pdf 1,752 × 1,239; 63 KB
-
EIOLCA1.jpg 603 × 382; 34 KB
-
EIOLCA3.jpg 597 × 382; 32 KB
-
Electrified World Power Flow.png 1,600 × 900; 583 KB
-
Elimination continuum.png 1,969 × 622; 14 KB
-
Endergonic Reaction.svg 512 × 315; 45 KB
-
Endotherme Reaktion mit Aktivierungsenergie.svg 1,114 × 511; 82 KB
-
Endtherme Reaktion ohne Aktivierungsenergie.svg 906 × 356; 42 KB
-
Energetics symbol.svg 316 × 340; 30 KB
-
-
Energia MAS.svg 399 × 182; 20 KB
-
Energia viaggi spaziali .jpg 1,563 × 1,379; 601 KB
-
Energiakaavio koripallopelistä.svg 1,052 × 744; 11 KB
-
Energie et Climat-esclaves énergétiques-energy slaves.jpg 800 × 1,131; 292 KB
-
Energie nette relative.jpg 855 × 559; 35 KB
-
Energie économisée, E-ship 1 Enercom, p un rotor Magnus.png 668 × 694; 39 KB
-
Energie économisée, E-ship 1 Enercon, pour un rotor Magnus.gif 631 × 694; 129 KB
-
Energiearten als Energieflussgraphik.png 1,858 × 986; 195 KB
-
Energiebilanz Motor.svg 600 × 450; 7 KB
-
Energosistema.svg 450 × 183; 118 KB
-
Energy 2021 United-States 0.png 3,249 × 1,911; 345 KB
-
Energy by major sectors of the economy.gif 486 × 461; 24 KB
-
Energy change in house I and house II.JPG 2,048 × 1,536; 217 KB
-
Energy clay.png 1,020 × 267; 30 KB
-
Energy Consumption in China from 1996-2001.png 793 × 511; 46 KB
-
Energy Density.PNG 885 × 633; 27 KB
-
Energy Diagram.PNG 578 × 362; 13 KB
-
Energy Factor Draw Patter Water Heaters.svg 1,000 × 1,000; 196 KB
-
Energy glass.png 1,020 × 267; 34 KB
-
Energy graph.JPG 616 × 384; 23 KB
-
Energy hemp.png 1,020 × 267; 33 KB
-
Energy Plus vs JCPL.jpg 960 × 720; 59 KB
-
Energy systems transition.webp 768 × 432; 50 KB
-
Energy table.JPG 628 × 298; 25 KB
-
Energy Value.png 1,404 × 692; 161 KB
-
Energy-and-economics1.png 980 × 673; 644 KB
-
Energy-Fiber.JPG 292 × 771; 24 KB
-
Energy-harmonic-motion.svg 355 × 138; 50 KB
-
Energy-Matrix.JPG 292 × 771; 25 KB
-
Energy-Sharing final rgb 600px.jpg 600 × 425; 84 KB
-
Energy-Total.JPG 292 × 771; 18 KB
-
EnergyDesityHydrogenKerosene.svg 1,080 × 675; 330 KB
-
Energyinput pr.jpg 276 × 358; 12 KB
-
Epex-Überschuss.jpg 1,000 × 600; 91 KB
-
Erdgas Einfuhrpreisindex Statistisches Bundesamt.png 1,653 × 993; 50 KB
-
Erneuerbare installierte Kapazität in China.svg 600 × 371; 174 KB
-
Erneuerbare installierte Kapazität in den Niederlanden in MW.svg 600 × 371; 174 KB
-
Erneuerbare installierte Kapazität in den USA in MW.svg 600 × 371; 186 KB
-
Esquema enerxías non renovables.png 639 × 436; 139 KB
-
Esquema enerxías renovables.png 1,024 × 768; 190 KB
-
ETC (zh-cn).svg 642 × 298; 42 KB
-
ETC et.png 642 × 298; 73 KB
-
Ethane conformations and relative energies-ru.svg 726 × 422; 2 KB
-
Ethane conformations and relative energies.svg 733 × 435; 20 KB
-
-
-
Excimer energy diagram.svg 330 × 215; 3 KB
-
Exergonic Reaction-el.svg 956 × 600; 26 KB
-
Fcc (100) stereograph.gif 548 × 546; 19 KB
-
Fencepv.png 807 × 663; 211 KB
-
-
-
Freeswingpv.png 624 × 583; 292 KB
-
GASEIOLCA1.JPG 292 × 474; 22 KB
-
Gasification Energy Use.JPG 567 × 327; 22 KB
-
Gatiltwood.png 1,438 × 718; 680 KB
-
Generación de energía eléctrica en España (2014).png 413 × 234; 9 KB
-
Generic energy system supplying fuels and electricity.svg 1,395 × 1,073; 145 KB
-
Geothermal technology overview.png 2,040 × 1,262; 1.83 MB
-
GeothermalEIOLCA2.JPG 293 × 477; 22 KB
-
Gesammtenergie-Energieumwandlung-chemische Reaktion.svg 512 × 260; 335 KB
-
Graph of SAG Mill vs. Household.png 487 × 136; 5 KB
-
Greenhouse Effect rev es.svg 771 × 619; 15 KB
-
Greenhouse Effect-ca.svg 1,000 × 769; 246 KB
-
Grid energy storage fr.jpg 1,476 × 1,000; 260 KB
-
Güneş Açıları.png 1,731 × 1,020; 369 KB
-
Hbond lengths unannotated.svg 425 × 421; 35 KB
-
Heat storage 2.png 833 × 528; 233 KB
-
II NEWTON'S RULE MISTAKE - new physic born.JPG 2,048 × 1,536; 583 KB
-
Incineration Energy Use.JPG 667 × 313; 19 KB
-
Incineration Toxic Chart.JPG 666 × 322; 22 KB
-
Inertie thermique batiment.jpg 827 × 499; 144 KB
-
Infografia energias.jpg 1,344 × 1,008; 284 KB
-
Installed Capacity Category wise(Jan-2021).jpg 1,280 × 720; 47 KB
-
Installed Capacity Jan-2021.jpg 1,280 × 720; 67 KB
-
Installierte Kapazität erneuerbarer Energien in Griechenland in MW.svg 600 × 371; 158 KB
-
Installierte Kapazität erneuerbarer Energien in Japan in MW.svg 600 × 371; 169 KB
-
Installierte Kapazität erneuerbarer Energien in Spanien in MW.svg 600 × 371; 179 KB
-
Installierte Photovoltaik-Kapazität in MW peak.svg 600 × 371; 79 KB
-
Installierte und geplante Offshore-Windenergie in Deutschland in MW.svg 600 × 371; 130 KB
-
Installierte Windkraftleistung in China, Deutschland, USA, in MW.svg 600 × 371; 132 KB
-
Isolated-and-non-isolated-systems.svg 640 × 320; 48 KB
-
Jahresdauerlinie.svg 610 × 340; 18 KB
-
Jahresmarktwerte Erneuerbare Energien.png 1,125 × 750; 14 KB
-
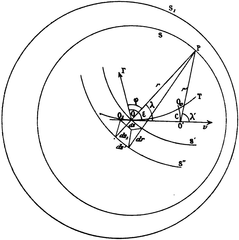
Journal de physique théorique et appliquée, tome 4, 1905 - page 167.png 997 × 1,001; 201 KB
-
Jährlicher Zubau an Solar- und Windenergie weltweit in MW (1).svg 600 × 371; 92 KB
-
Kardashoven eskala.png 2,000 × 1,350; 90 KB
-
Karmann gabrielli diagram.jpg 604 × 809; 124 KB
-
Kohle jan2024.png 1,500 × 937; 58 KB
-
KohleverstromungDeutschlandJan2020.png 500 × 800; 27 KB
-
KPs01.JPG 1,208 × 759; 32 KB
-
Kraftwerkseinsatz BZN DE-LU Januar 2020.png 260 × 800; 16 KB
-
Kraftwerkseinsatz Jan2024.png 937 × 2,250; 71 KB
-
Kscaleprojections.png 1,115 × 647; 23 KB
-
Last Prognose Jan2024.png 1,875 × 750; 41 KB
-
-
Li-S battery EN.png 697 × 777; 152 KB
-
Li-S battery IT.png 713 × 796; 153 KB
-
Major components of the Gate 5 Energy System.jpg 1,280 × 720; 196 KB
-
Markovnikov's rule diagram.png 1,451 × 1,303; 42 KB
-
Merit-Order-ErlöseErzeugung.png 400 × 600; 9 KB
-
Merit-Order-klein.png 400 × 500; 14 KB
-
Merit-Order-Marktpreiseffekt.png 400 × 500; 7 KB
-
Merit-Order-ohneKostenbloecke.png 400 × 600; 8 KB
-
MeritOrder.png 400 × 500; 20 KB
-
MeritOrderEffekt.png 400 × 500; 20 KB
-
Mieterstrom - Funktionsprinzip.png 852 × 526; 130 KB
-
Mieterstrom - Grundidee.png 944 × 438; 160 KB
-
Model Predictive Control (MPC).pdf 793 × 302; 37 KB
-
Modern-renewable-prod.svg 850 × 600; 48 KB
-
Nachfrageschwankungen.JPG 604 × 510; 22 KB
-
Near future of electric vehicles same.jpg 1,448 × 1,254; 144 KB
-
NIF output over 10 years.png 1,162 × 864; 39 KB
-
Nouveaux modèles John Deere de 1915 à 1975.png 2,656 × 1,531; 52 KB