This document summarizes projections for global agriculture between 2016-2018 and 2028. It finds that real agricultural prices will remain low and demand for commodities will depend on food, feed, fuel and other uses. Production is projected to grow fastest in developing regions like India and Africa. Agricultural trade balances and specialization between regions will continue increasing over time.
CGIAR and Climate-Smart Agriculture
The document discusses the importance of climate-smart agriculture (CSA) in addressing climate change impacts. CSA aims to increase agricultural productivity and incomes, enhance resilience of food systems and reduce greenhouse gas emissions. Significant CSA successes highlighted include China paying farmers to plant trees which sequestered over 700,000 tons of carbon, and coffee-banana agroforestry systems in Africa increasing smallholder incomes by over 50% while providing climate mitigation. The document argues spreading agroforestry across Africa could boost food production, sequester billions of tons of carbon annually, and improve resilience for over 140 million people. Direct agricultural emissions vary widely by region and sector. CSA offers
Madhur Gautam, David Laborde, Abdullah Mamun, Will Martin, Valeria Piñeiro, Rob Vos
POLICY SEMINAR
Can agricultural policies deliver better value for money for people, the planet, and the economy?
Co-Organized by IFPRI and World Bank Group
FEB 2, 2022 - 9:30 TO 11:00AM EST
Presentation by Maximo Torero Cullen, Chief Economist, FAO at the Food Loss and Waste in Fruit and Vegetable Supply Chains policy seminar, jointly organized by IFPRI, Embassy of Denmark, and World Resources Institute
Research Outputs and Approaches to Enhance Food Security and Improve Livelih...ICARDA
The document summarizes research outputs and approaches from the International Center for Agricultural Research in the Dry Areas (ICARDA) to enhance food security and improve livelihoods. It discusses constraints like drought, desertification, and climate change leading to food insecurity. ICARDA's strategic plan focuses on risk management, integrated water and land management, and diversification to improve nutrition and incomes. Technologies developed include improved crop varieties tolerant to abiotic stresses and diseases, as well as seed production approaches to cope with drought.
The document summarizes constraints to food security and poverty in dry areas, and discusses ICARDA's research approaches and outputs to enhance food security and livelihoods. It outlines challenges including climate change, water scarcity, and population growth. ICARDA's strategic plan focuses on risk management, integrated water and land management, diversification, and capacity building. The organization develops improved crop varieties and management practices to intensify sustainable production and increase resilience to stresses.
ICRISAT Global Planning Meeting 2019: Food Systems Futures & the SDGs: Can we...ICRISAT
What are the prospects for achieving SDG2: Ending Hunger: possible for caloric adequacy but uncertain for access to food diversity, especially micro-nutrient rich food. Ending all forms of malnutrition: declines in the incidence of child stunting & wasting, but sharp rise in obesity rates. Double small farm productivity: unlikely for the least developed countries & lagging regions in emerging economies.
The document discusses issues around global food loss and waste. Some key points:
- 1.3 billion tonnes of food is lost or wasted annually, amounting to 1/3 of all food produced for human consumption.
- Food loss and waste amounts to squandering of resources like water, land, energy, labor and capital. It also produces greenhouse gas emissions contributing to climate change.
- Solutions and strategies focus on improving efficiency and sustainability across food supply chains from production to consumption. Reducing food loss and waste can provide economic and environmental benefits.
This document discusses opportunities in the global agricultural sector, with a focus on opportunities in Nigeria. It notes that global demand for agricultural produce is increasing due to population growth, urbanization, rising incomes, and other factors. This is putting pressure on grains and cassava production. It also discusses the increasing global demand for protein as middle classes and incomes rise. Specific opportunities mentioned for Nigeria include investing in arable land, cassava production, fisheries, poultry, and animal husbandry. The document provides statistics and analysis to support these points.
Rosegrant, Mark. 2023. Climate Change and Agriculture: Impacts, Adaptation, and Mitigation. PowerPoint presentation given during university-wide seminar. Texas State University, San Marcos, Texas, March 30, 2023.
Overview of the Feed Grain Market in MoldovaIJAEMSJORNAL
This article provides comprehensive information on the national grain market and addresses current issues regarding its development. It analyzes statistical data depicting the current state and trends within the Moldovan grain market, including the fluctuation of grain prices over time. This analysis draws pertinent conclusions, and the primary challenges hindering the market's effective development are highlighted. The aim of the research was to analyze the formation and development of the regional feed grain market in the economic context of the Republic of Moldova. To present and analyze the information, the realities and conditions of the grain market's functioning were examined, along with the specific features of forming the regional feed grain market.
India's agriculture sector currently employs 60% of the population and ensures food security, but faces issues like low productivity, lack of irrigation and storage facilities, and decreasing farm sizes. The document argues that India should focus on agriculture to maintain food and price stability, provide raw materials to industries, and offer employment and purchasing power in rural areas. It identifies key areas for investment like irrigation, storage infrastructure, seeds and mechanization to boost productivity and reduce post-harvest losses.
Doubling Farmers’ Income through animal agriculture: Need for policy changeILRI
Presented by Habibur Rahman, Vijayalakshmy Kennady and Braja B Swain (ILRI), at the International Conference on Doubling the Farmers Income, Assam Agricultural University, Assam, India, 27–28 February 2019
- Global consumption and production of livestock products is projected to increase significantly by 2050, especially in Africa and the Middle East. Meat consumption is expected to increase 37% globally while milk consumption increases 61%.
- Livestock production systems in Africa are transitioning rapidly to more industrialized systems for monogastrics like pork and poultry, though over 30% will still be small-holder in 2050. Ruminant production will continue to rely on mixed crop-livestock systems.
- Animal diseases pose major constraints to Africa's livestock sector, resulting in high mortality rates and economic losses. As production intensifies, diseases may also increase unless addressed by improved vaccines, diagnostics, and delivery systems.
Agricultural transformation in PNG can be understood from an agri-food system perspective. This involves (1) rising farm productivity to increase food production and consumption for subsistence farmers, (2) linking farmers to local markets so they can sell surpluses to raise incomes and create local jobs, and (3) engaging the rural non-farm economy so farmers and others start businesses that generate demand and incomes across rural areas. Together these steps can help harness urban markets where urban consumer demand drives more value-addition of agricultural products and diversification opportunities. Currently, PNG's industry and service sectors have contributed more to economic growth than agriculture, but slow agricultural output growth suggests little improvement in rural welfare. Analyzing the full ag
Low and middle-income countries will drive growth in global food demand between now and 2030. Diets in these regions are diversifying to include more animal proteins and consumption of meat, fish, dairy and eggs is increasing. However, per capita calorie availability will show only limited convergence between rich and poor countries. Global agricultural production will increase primarily through rising yields rather than expansion of farmland. Key producing regions include China, India, and parts of Southeast Asia for staples, and China for meat, particularly pork and poultry. International trade will remain important for global food security, with some regions highly dependent on imports.
The document summarizes commodity market developments and their implications for specific agricultural sectors, as well as an outlook on commodity prices. Key factors driving up commodity prices are discussed, such as growth in global population and income, China's increasing demand for resources, and the impact of biofuels production. Challenges facing meat producers from high feed costs are also noted. The outlook suggests that even as prices decline, they will remain above 2004 levels on average. The document concludes by reviewing recent policy responses in various countries to high food prices.
This document summarizes key issues related to agrarian change and rural development. It discusses increasing demand for healthier diets in developing countries and the need for more inclusive and value-added agricultural value chains. It also examines farming systems and the need to balance efficiency and sustainability. Specific topics covered include changing diets, the bifurcation of farm structures into larger commercial and smaller subsistence operations, and the "missing middle" of rural support services. The document then discusses strategies for inclusive rural development through innovation, intensification and supply chain integration. It identifies knowledge gaps around data availability and impact evaluations and outlines an outlook focused on improving rural productivity and value chains.
Similar to The OECD-FAO Agricultural Outlook 2024-2033 (20)
At Chicago Connection - Downtown, we're proud to be your go-to spot for authentic Chicago-style pizza and delicious Italian comfort food. Whether you're dining in our casual atmosphere, grabbing takeout, or getting delivery through our Hot Oven Express trucks, we strive to never disappoint.
We use only the freshest ingredients, pile on the cheese, and offer a wide variety to satisfy all cravings. From our famous pastas and sandwiches to our award-winning salad bar (one of the best in Boise!), there's something for everyone.
We're especially proud of our gluten-free pizza options, ensuring everyone can enjoy a delicious meal with friends and family. Our Hot Oven Express trucks have been a Treasure Valley staple since 1982, guaranteeing your pizza arrives hot and fresh no matter where you are. And when the weather's nice, enjoy your meal on our outdoor patio seating!
At Chicago Connection - Downtown, friendly service and timely delivery are our promises. Wether you're craving our Double Deluxe Pepperoni or something new from our menu, we know you'll leave satisfied. Visit our website or call us at (208) 342-3434 to learn more or place an order today!"
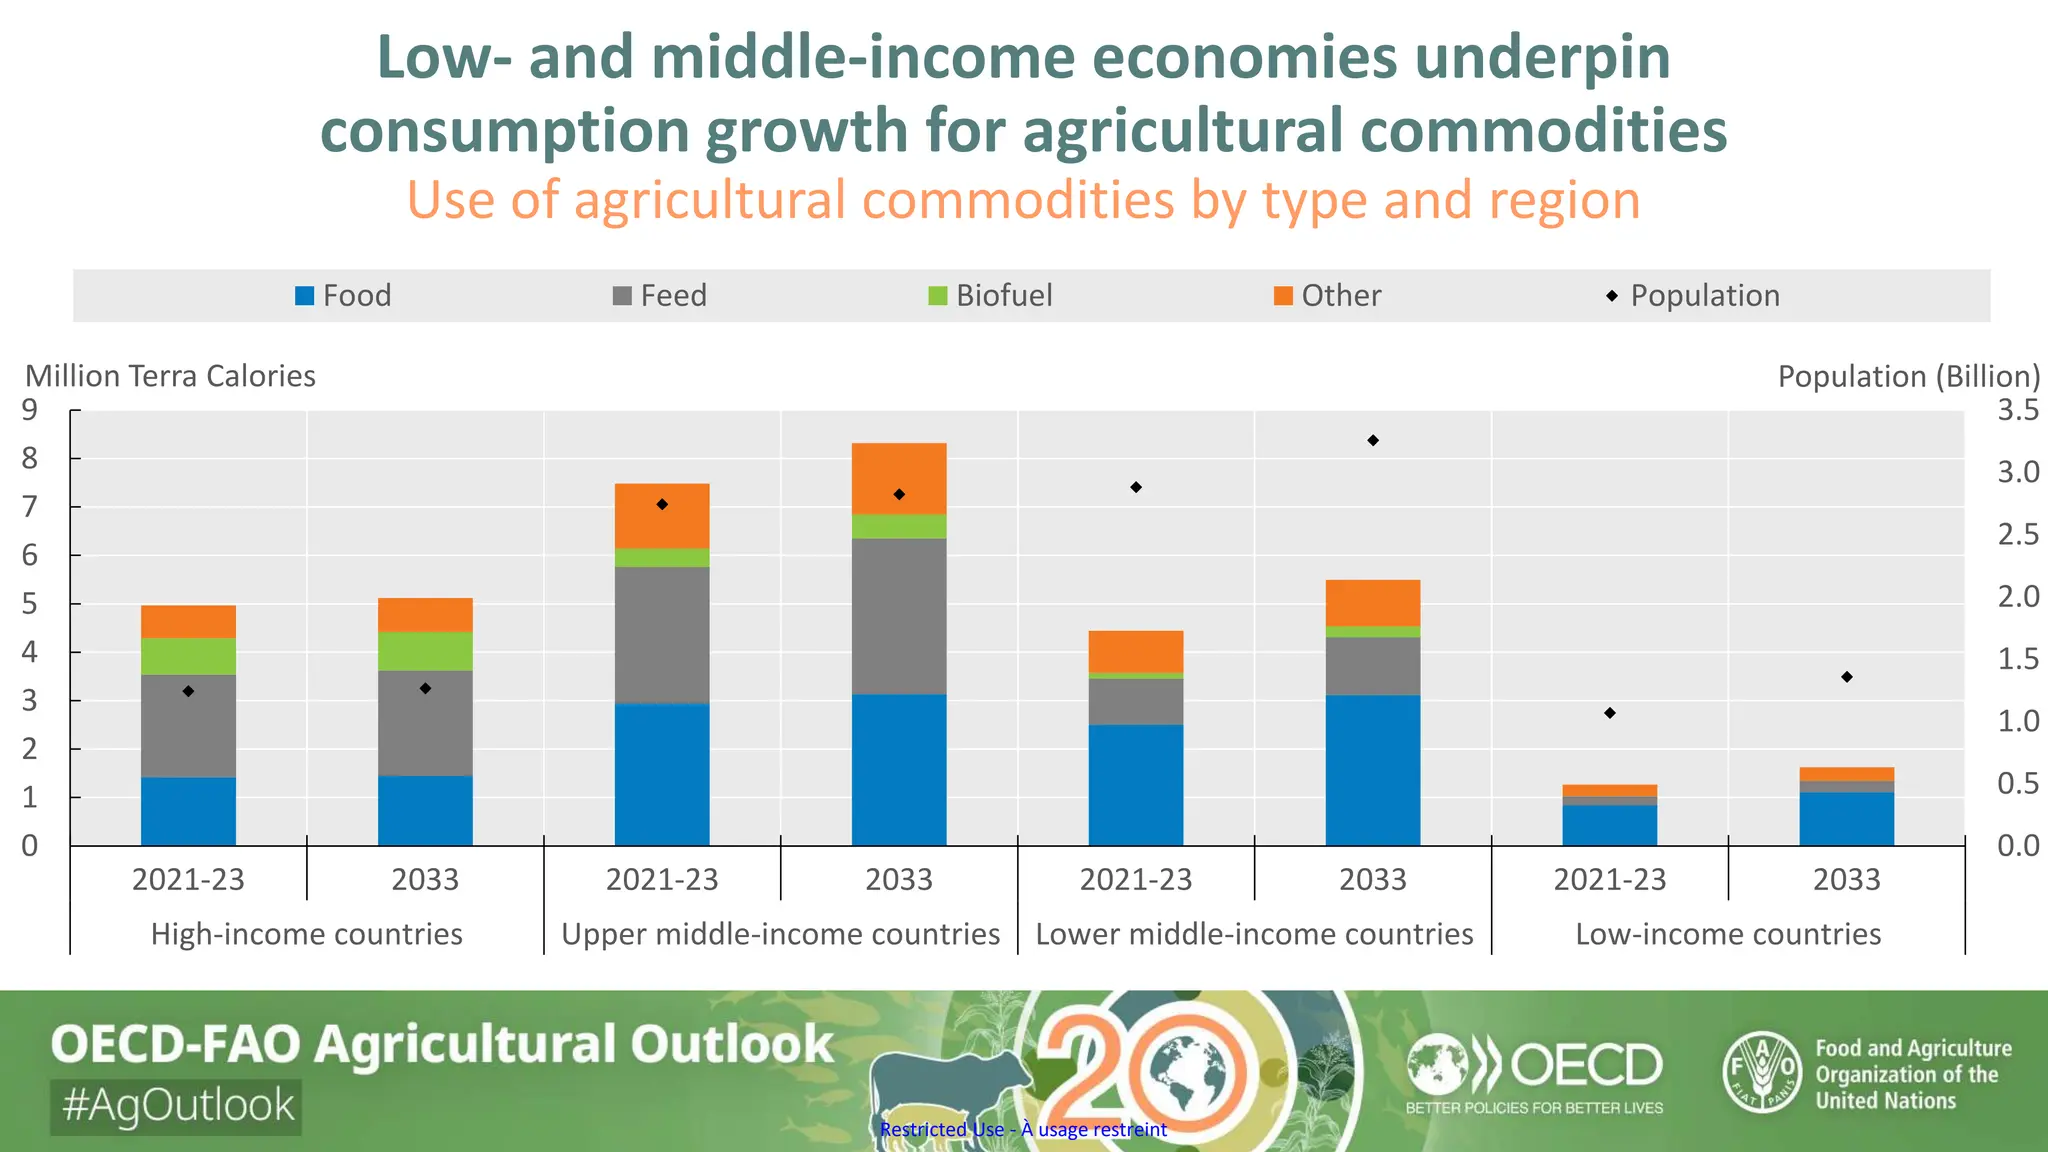
1. Restricted Use - À usage restreint
Low- and middle-income economies underpin
consumption growth for agricultural commodities
Use of agricultural commodities by type and region
0.0
0.5
1.0
1.5
2.0
2.5
3.0
3.5
0
1
2
3
4
5
6
7
8
9
2021-23 2033 2021-23 2033 2021-23 2033 2021-23 2033
High-income countries Upper middle-income countries Lower middle-income countries Low-income countries
Population (Billion)
Million Terra Calories
Food Feed Biofuel Other Population
2. Restricted Use - À usage restreint
Calorie intake is rising but dietary diversification remains slow
Contribution of food groups to total daily per capita calorie intake
0
500
1000
1500
2000
2500
3000
2021-23 2033 2021-23 2033 2021-23 2033 2021-23 2033
High-income countries Upper middle-income countries Lower middle-income countries Low-income countries
kcal/day/person Staples Animal Products Fats Sweeteners Vegetables & fruits Other MDER (2022)
3. Restricted Use - À usage restreint
Growing feed use is driven by expansion of herds and increasing
intensification of livestock and aquaculture production systems
Change in demand for main feed categories
0
50
100
150
200
250
2014-23 2024-33 2014-23 2024-33 2014-23 2024-33 2014-23 2024-33
High-income countries Upper middle-income countries Lower middle-income countries Low-income countries
Low protein feed Medium protein feed High protein feed
Mt
4. Restricted Use - À usage restreint
Emerging economies lead the expansion in the use of primary
agricultural commodities as feedstocks in biofuels production
Share of biofuel and other industrial uses in total use of agricultural commodities
0
10
20
30
40
50
60
70
80
2021-23 2033 2021-23 2033 2021-23 2033 2021-23 2033 2021-23 2033 2021-23 2033 2021-23 2033
Wheat Rice Other coarse grains Maize Sugarcane Vegetable oil Molasses
% % of biofuel in total use % of other industrial uses in total use
5. Restricted Use - À usage restreint
Growth in production continues to be supported mainly by yield gains
in low- and middle-income countries
Trends in global agricultural production
0
5
10
15
20
25
30
0
100
200
300
400
500
600
700
800
900
2021-23 2033 2021-23 2033 2021-23 2033 2021-23 2033 2021-23 2033 2021-23 2033 2021-23 2033 2021-23 2033
India China Asia Pacific (excl.
China and India)
Sub-Saharan Africa Near East and North
Africa
Europe and Central
Asia
North America Latin America and the
Caribbean
%
Bln 2014-16 USD
Crops Livestock Fisheries Growth in production, 2021-23 to 2033 (right axis)
6. Restricted Use - À usage restreint
Yield improvements support production growth
but there is scope for sustainable intensification
Change in projected yields for selected crops and regions, 2021-23 to 2033
0
2
4
6
8
10
12
2021-23 2033 2021-23 2033 2021-23 2033 2021-23 2033 2021-23 2033 2021-23 2033 2021-23 2033 2021-23 2033
Wheat Maize Other coarse
grains
Rice Soybeans Other Oilseeds Pulses Roots and tubers
Developed and East Asia South and Southeast Asia Sub-Saharan Africa Near East and North Africa
Europe and Central Asia North America Latin America and Caribbean Global average
t/ha
7. Restricted Use - À usage restreint
Agriculture’s global GHG emissions intensity will decline despite rising
emissions in lower and lower-middle income countries
GHG emissions and emissions intensity from agriculture, 2021-23 to 2033
Developed and East
Asia
South and Southeast
Asia
Sub-Saharan Africa
Near East and North
Africa
Europe and Central
Asia
Latin America and
Caribbean
North America
-1
-0.5
0
0.5
1
1.5
2
2.5
3
-0.5 0 0.5 1 1.5 2 2.5 3
Annual change in GHG
emissions (%)
Annual change in production (%)
8. Restricted Use - À usage restreint
Halving food loss and waste has the potential
to reduce global agricultural GHG emissions by 4% and
the number of undernourished people by 153 million by the year 2030
Impact on calorie intake and agricultural direct GHG emissions
of halving food loss and waste by 2030
-6
-4
-2
0
2
4
6
8
10
12
World High-income countries Upper middle-income
countries
Lower middle-income
countries
Low-income countries
%
Calories Agricultural direct GHG emissions
9. Restricted Use - À usage restreint
Growth of agricultural trade will slow down
and export growth will stabilise
Exports as a percentage of production
0
10
20
30
40
50
60
70
Roots
and
tubers
Ethanol
Butter
Pigmeat
Rice
Poultry
Biodiesel
Other
oilseeds
Cheese
Maize
Other
coarse
grains
Beef
Fish
Wheat
Cotton
Vegetable
oils
Sugar
Soybean
Whole
milk
powder
Skim
milk
powder
2011-13 2021-23 2033
%
10. Restricted Use - À usage restreint
Prices will resume their long-run trend following 2022 peak
Long-term evolution of commodity prices, in real terms
0
50
100
150
200
250
300
350
400
450
500
1961
1964
1967
1970
1973
1976
1979
1982
1985
1988
1991
1994
1997
2000
2003
2006
2009
2012
2015
2018
2021
2024
2027
2030
2033
(2019=100) Soybeans Wheat Maize Beef Pork
Editor's Notes
Note: the shares are calculated from the data in calories equivalent. The 38 individual countries and 11 regional aggregates in the baseline are classified into the four income groups according to their respective per-capita income in 2018. The applied thresholds are: low: < USD 1 550, lower-middle: < USD 3 895, upper-middle: < USD 13 000, high: > USD 13 000.
Note: Estimates are based on historical time series from the FAOSTAT Food Balance Sheets database which are extended with the Outlook database. Products not covered in the Outlook are extended by trends. The 38 individual countries and 11 regional aggregates in the baseline are classified into the four income groups according to their respective per-capita income in 2018. The applied thresholds are: low: < USD 1 550, lower-middle: < USD 3 895, upper-middle: < USD 13 000, high: > USD 13 000. Staples include cereals, roots and tubers and pulses. Animal products include meat, dairy products (excluding butter), eggs and fish. Fats include butter and vegetable oil. Sweeteners include sugar and HFCS. The category other includes other crop and animal products. MDER stands for minimum dietary energy requirement
Note: Low protein feed includes maize, wheat, other coarse grains, rice, cereal brans, beet pulp, molasses, roots and tubers. Medium protein feed includes dried distilled grains, pulses, whey powder. High protein feed includes protein meal, fish meal, and skim milk powder. The 38 individual countries and 11 regional aggregates in the baseline are classified into the four income groups according to their respective per-capita income in 2018. The applied thresholds are: low: < USD 1 550, lower-middle: < USD 3 895, upper-middle: < USD 13 000, high: > USD 13 000.
Note: Estimates are based on historical time series from the FAOSTAT Value of Agricultural Production domain which are extended with the Outlook database. Remaining products are trend-extended. The net value of production uses own estimates for internal seed and feed use. Values are measured at constant USD of the period 2014-2016.
Note: Yields are defined as tonnes produced per area harvested. Each symbol represents the average yield for a given commodity within a region. The red lines correspond to the global average per commodity.
Note: This figure shows projected annual growth in direct GHG emissions from agriculture together with annual growth in the estimated net value of production of crop and livestock commodities covered in the Outlook (measured in constant USD 2014-16 prices). The size of the bubbles corresponds to the level of agricultural GHG emissions in the baseline period 2021-2023. Estimates are based on historical time series from the FAOSTAT Climate Change: Agrifood systems emissions databases which are extended with the Outlook database.CO2 equivalents are calculated using the global warming potential of each gas as reported in the IPCC Sixth Assessment Report (AR6). Emission types that are not related to any Outlook variable (organic soil cultivation and burning savannahs) are kept constant at their latest available value. The category ''other'' includes direct GHG emissions from burning crop residues, burning savanna, crop residues, and cultivation of organic soils. The net value of production uses own estimates for internal seed and feed use.
Note: Emission estimates are based on historical time series from the FAOSTAT Climate Change: Agrifood systems emissions databases which are extended with the Outlook and Scenario databases. The 38 individual countries and 11 regional aggregates in the baseline are classified into the four income groups according to their respective per-capita income in 2018. The applied thresholds are: low: < USD 1 550, lower-middle: < USD 3 895, upper-middle: < USD 13 000, high: > USD 13 000.
Note: This share is computed as exports over production (in volume).
Note: Historical data for soybeans, wheat, maize and beef from World Bank, "World Commodity Price Data" (1960-1989). Historical data for pork from USDA QuickStats (1960-1989).